Carbon Calculator
Coding · 2024–2025 · Co-built with Luis Rosario-Alers: ideas, docs, presenting
Built with Python, Qt, SQLite
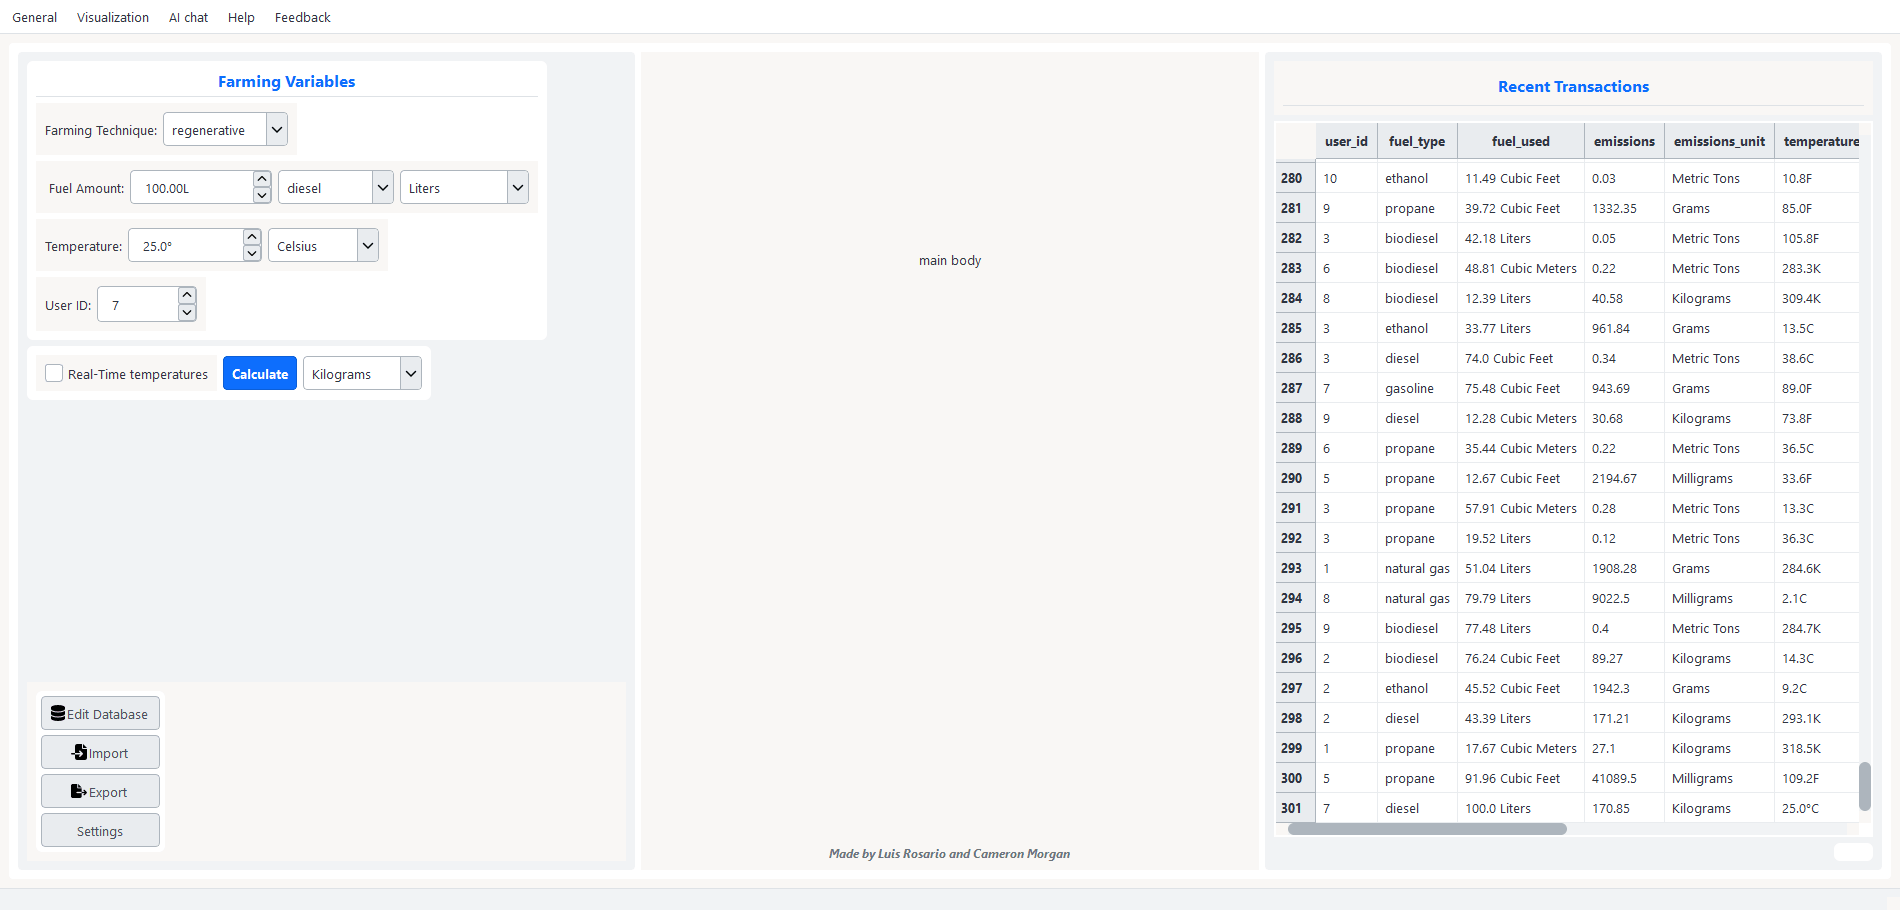
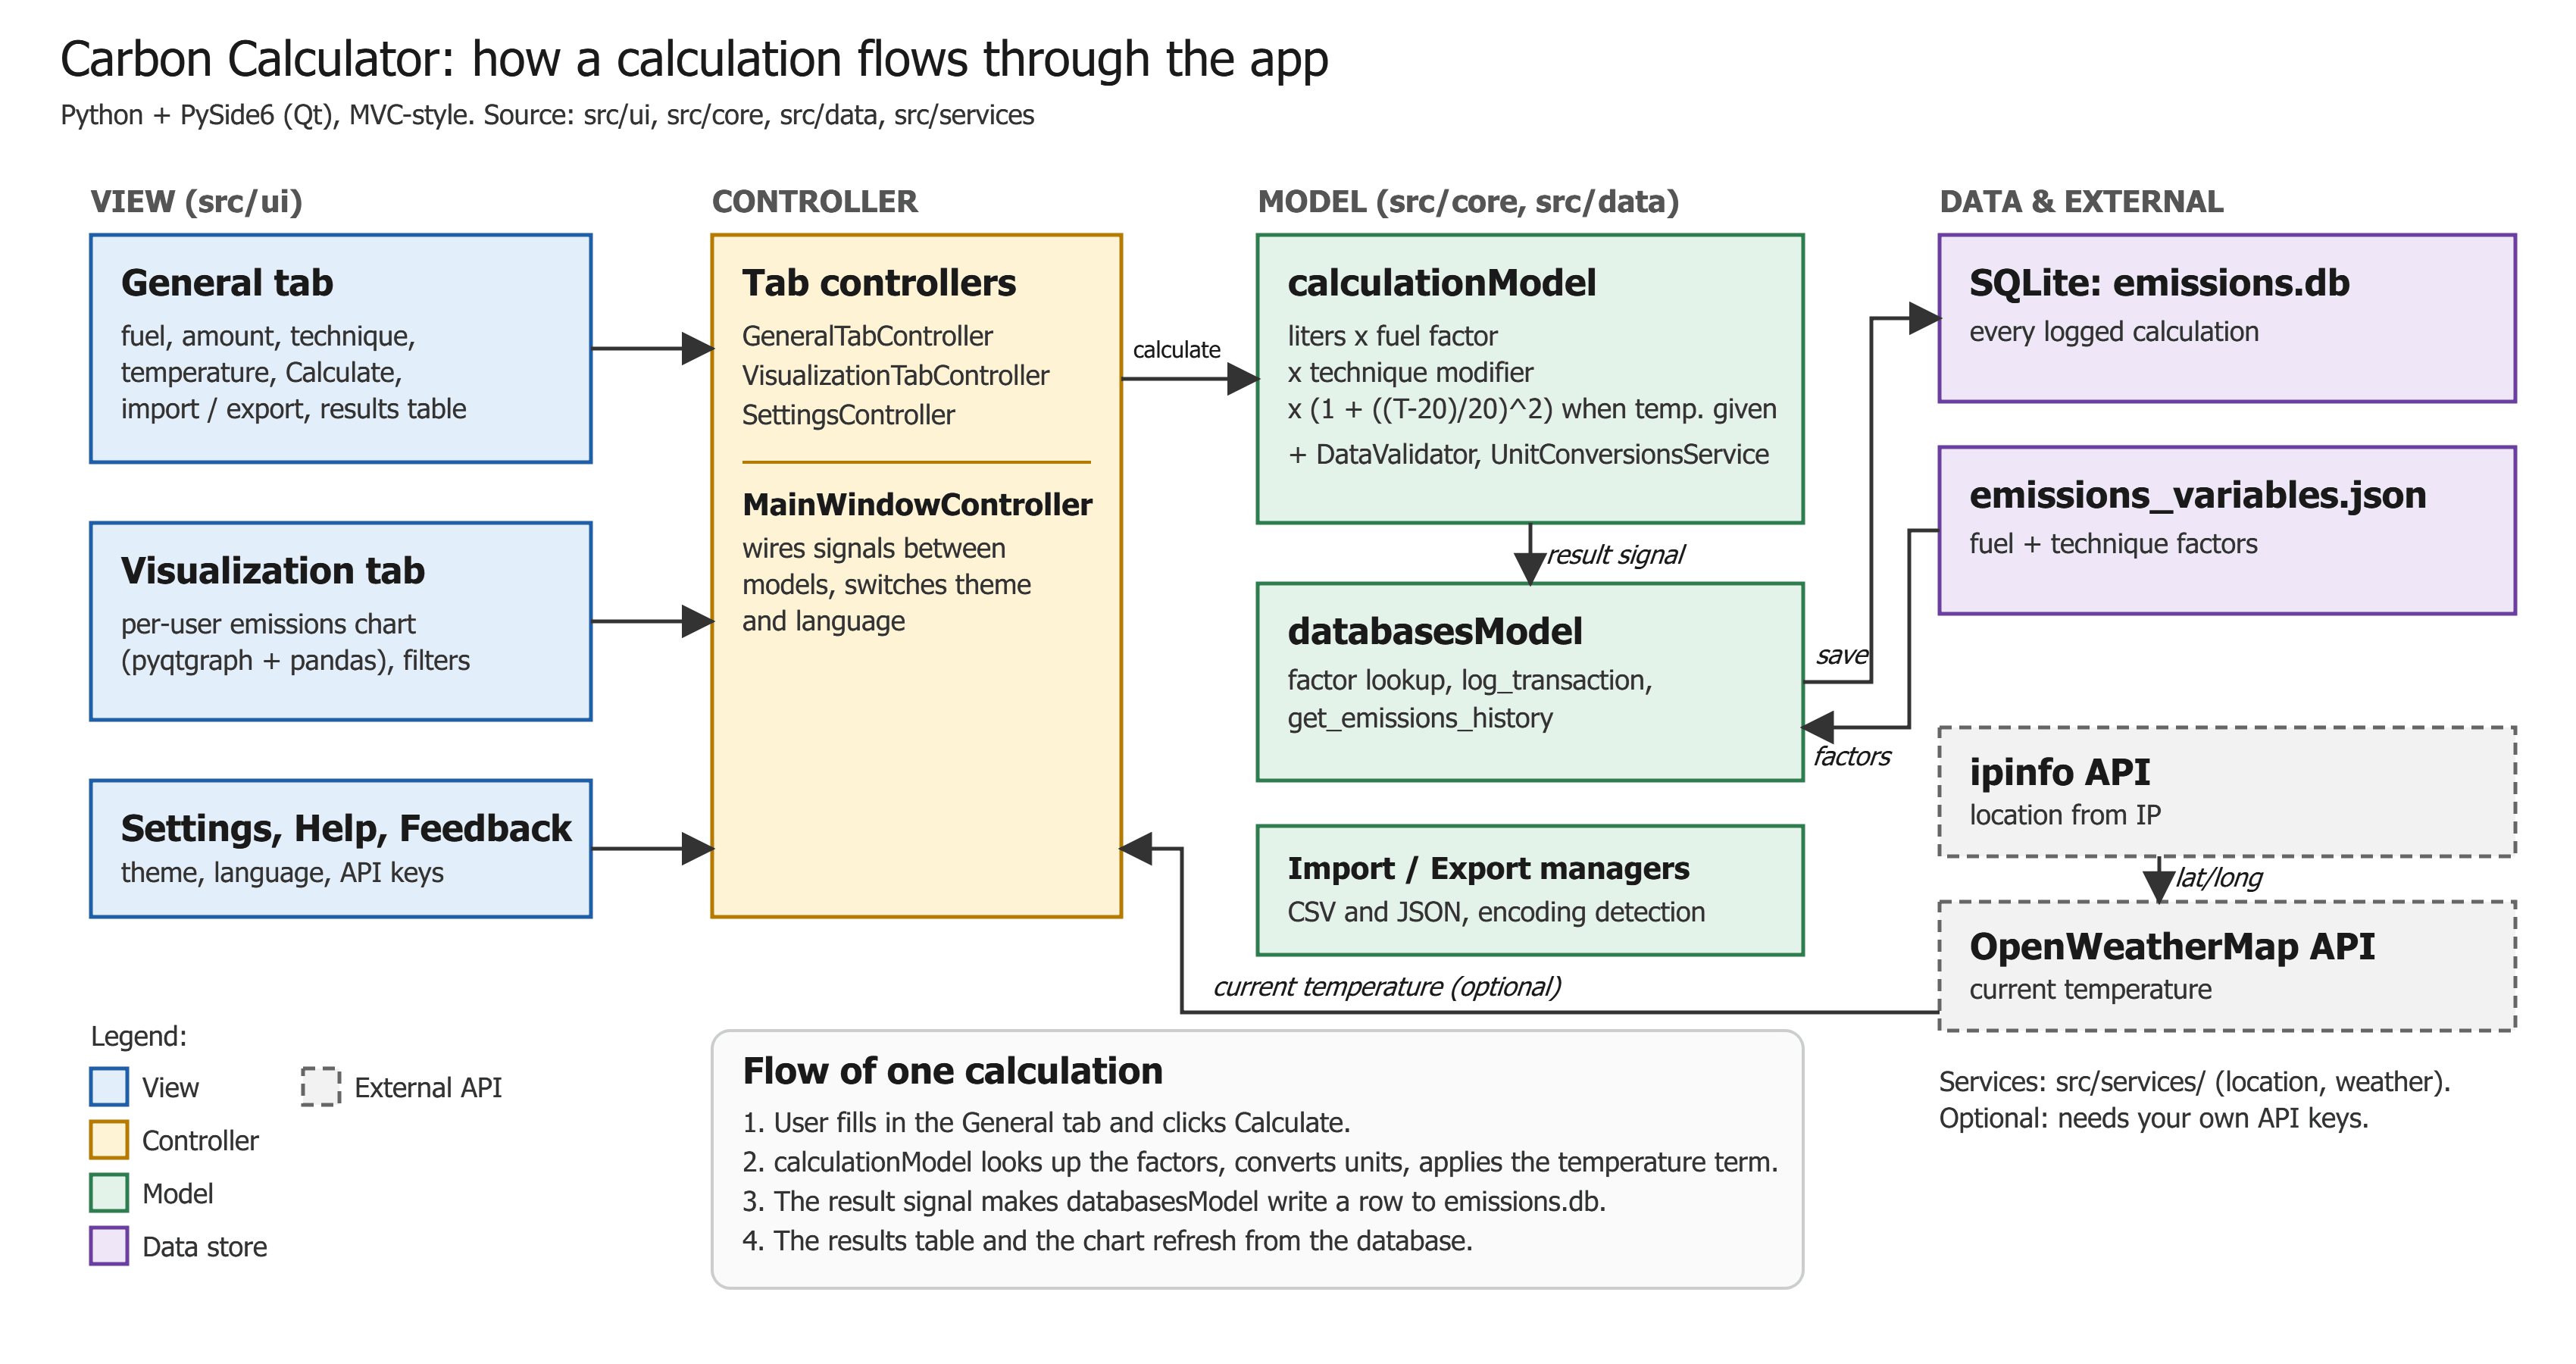
A desktop app that helps farms estimate the carbon emissions from their fuel, then log and chart them over time. Luis and I built it as a proof of concept for a school academic-team competition.
The idea
Small farms rarely have an easy way to measure their emissions. The goal of this app is to take a farmer’s fuel use and farming method and estimate the result. It can also import and export data, pull in local weather, and chart results.
How it calculates
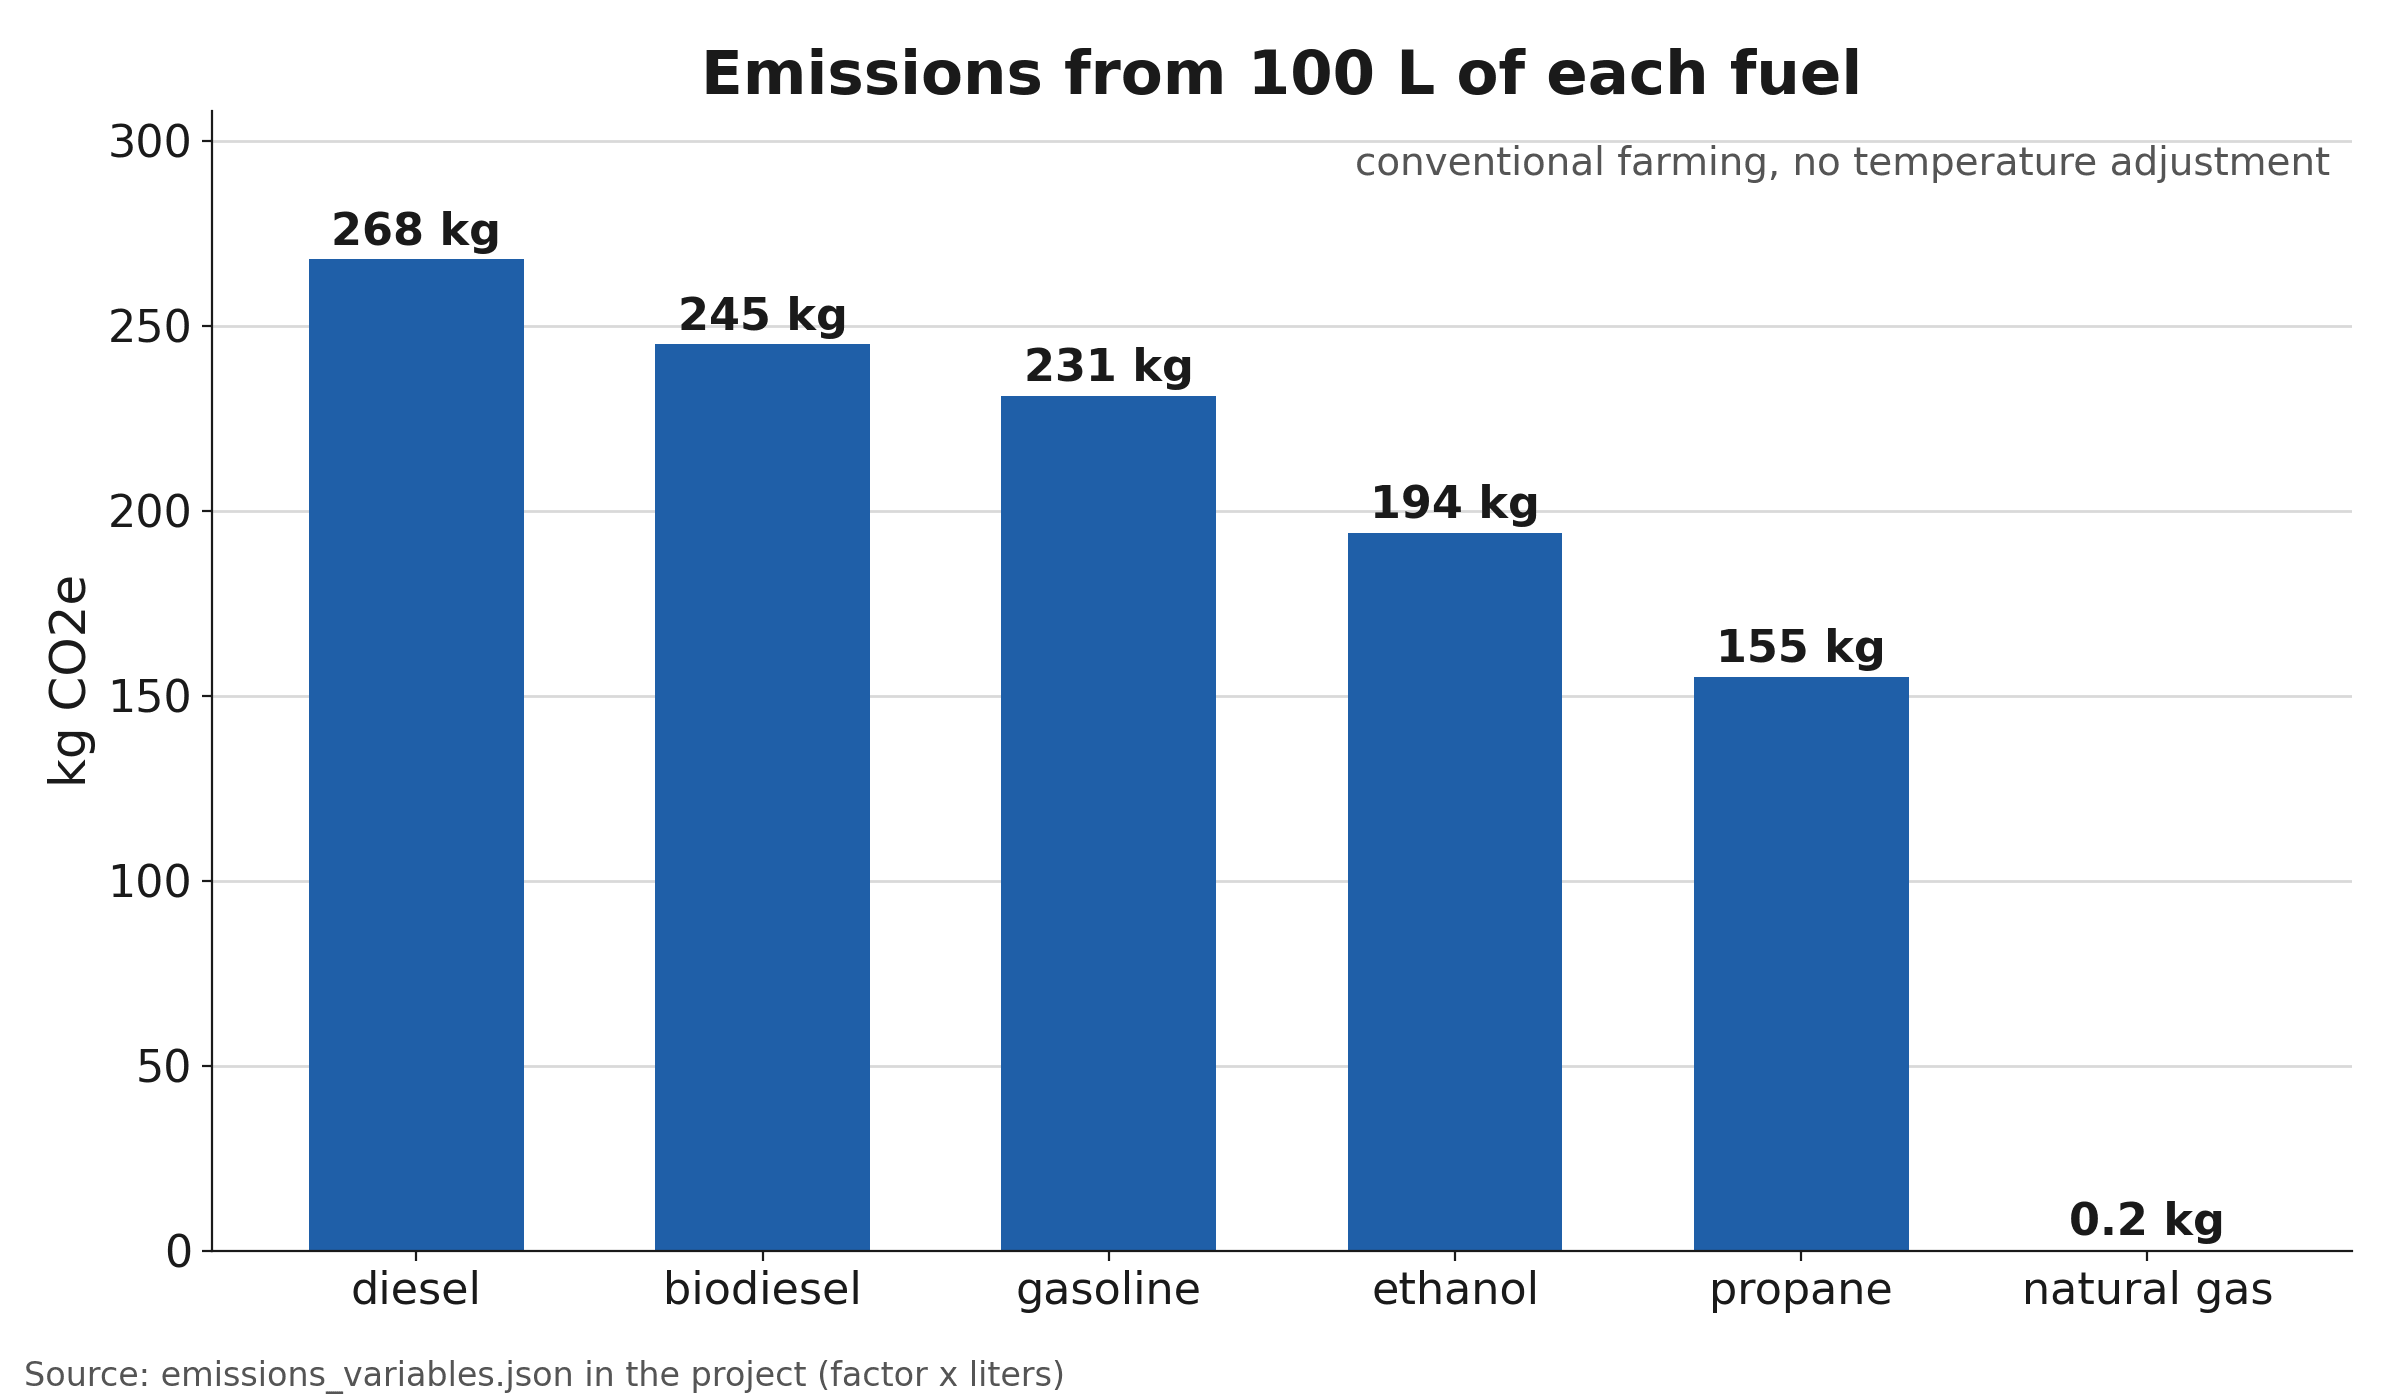
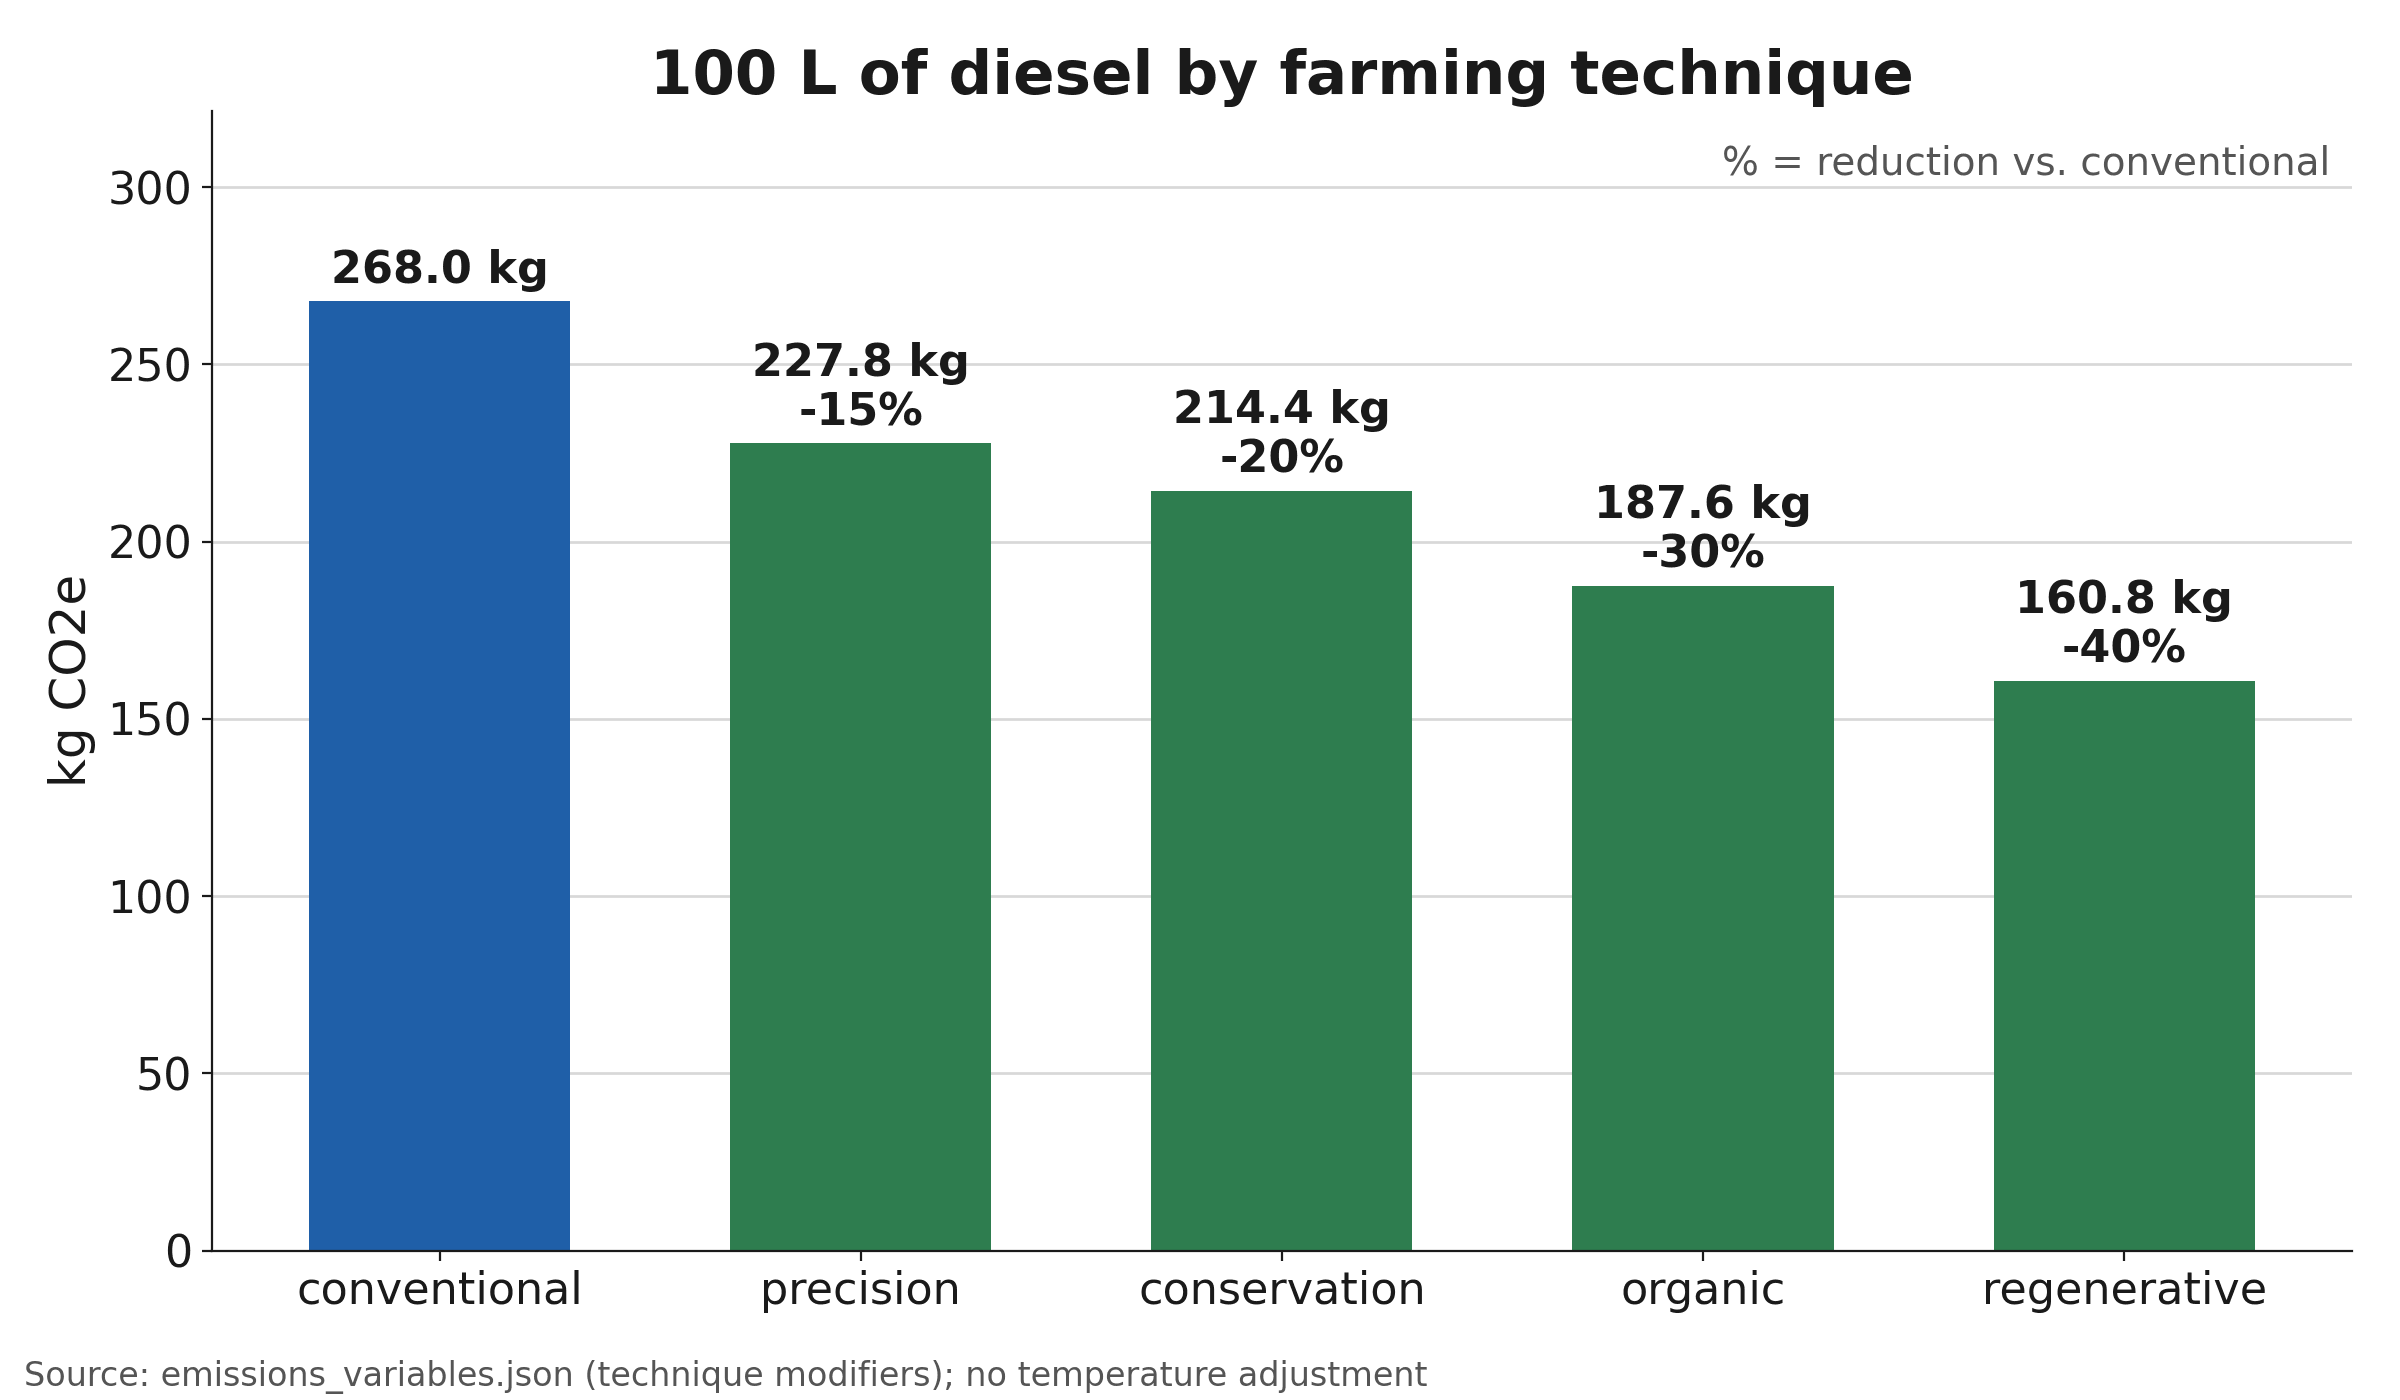
Emissions = fuel used × the fuel's emission factor × a farming-technique modifier. 100 L of diesel under conventional farming is 100 × 2.68 × 1.0 = 268 kg CO2e; under regenerative farming (0.6) it's 160.8 kg, 40% less.
- Fuels: gasoline, diesel, natural gas, propane, ethanol, and biodiesel.
- Techniques: conventional, conservation, organic, precision, and regenerative.
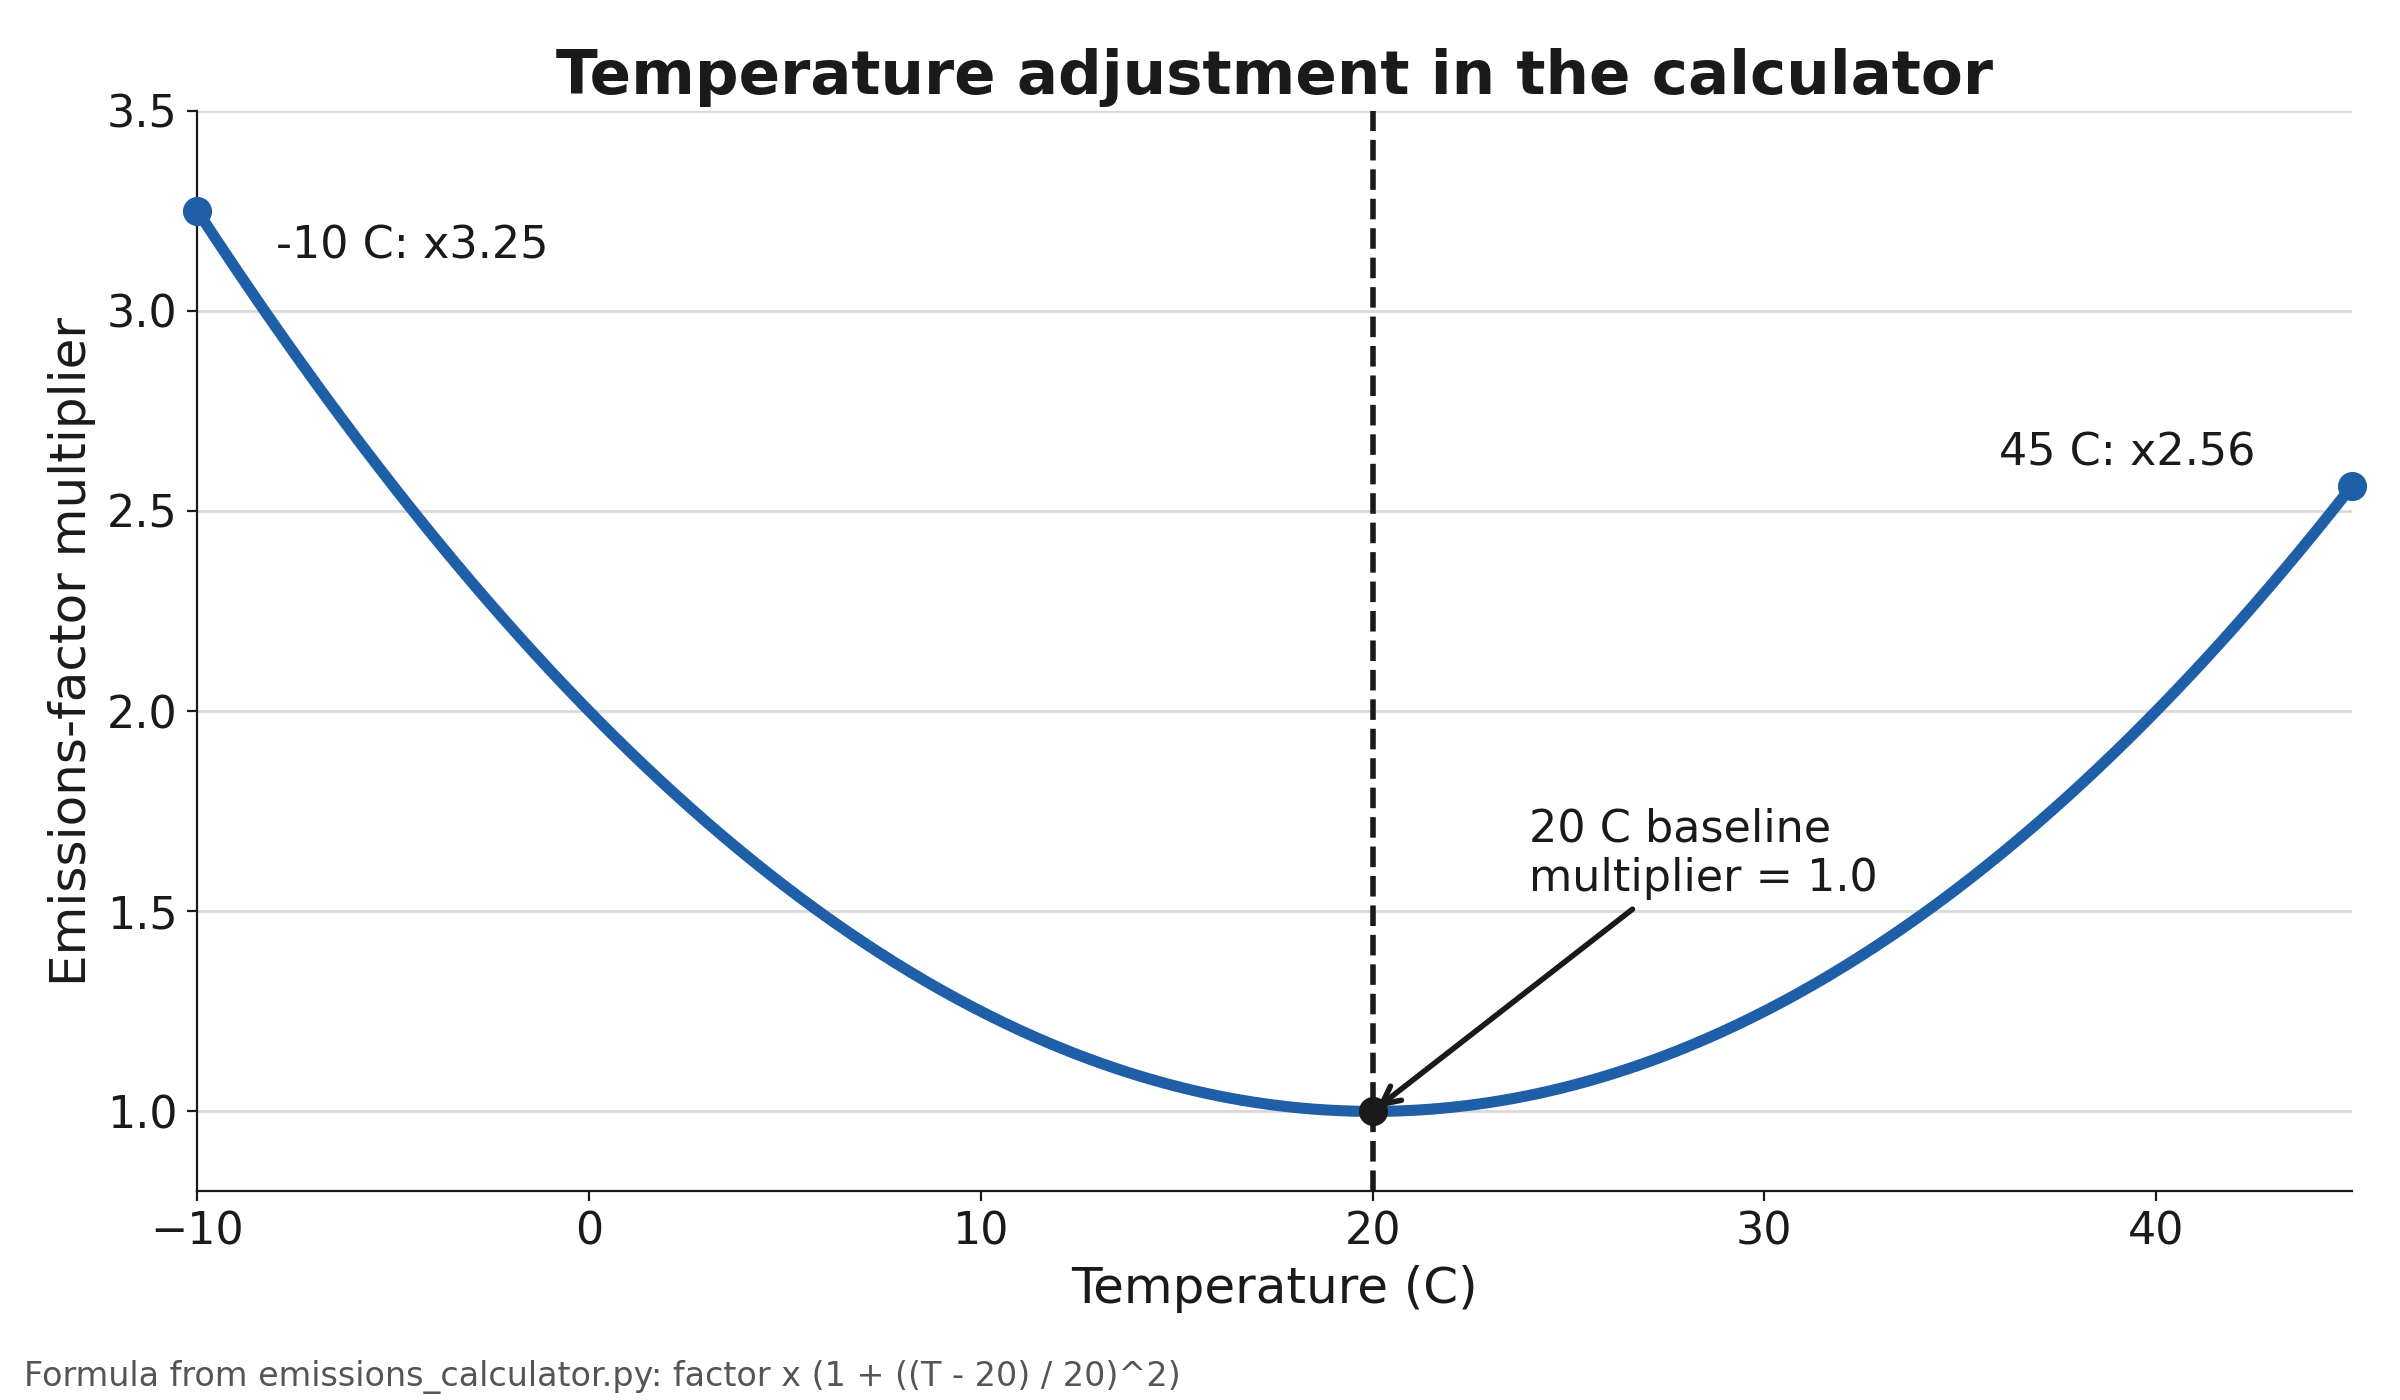
- Optional temperature adjustment; output in mg, g, kg, or metric tons.
The technique modifiers and temperature adjustment are our own modeling choices, not published figures, so it's a proof of concept, not a certified calculator.
Charting results
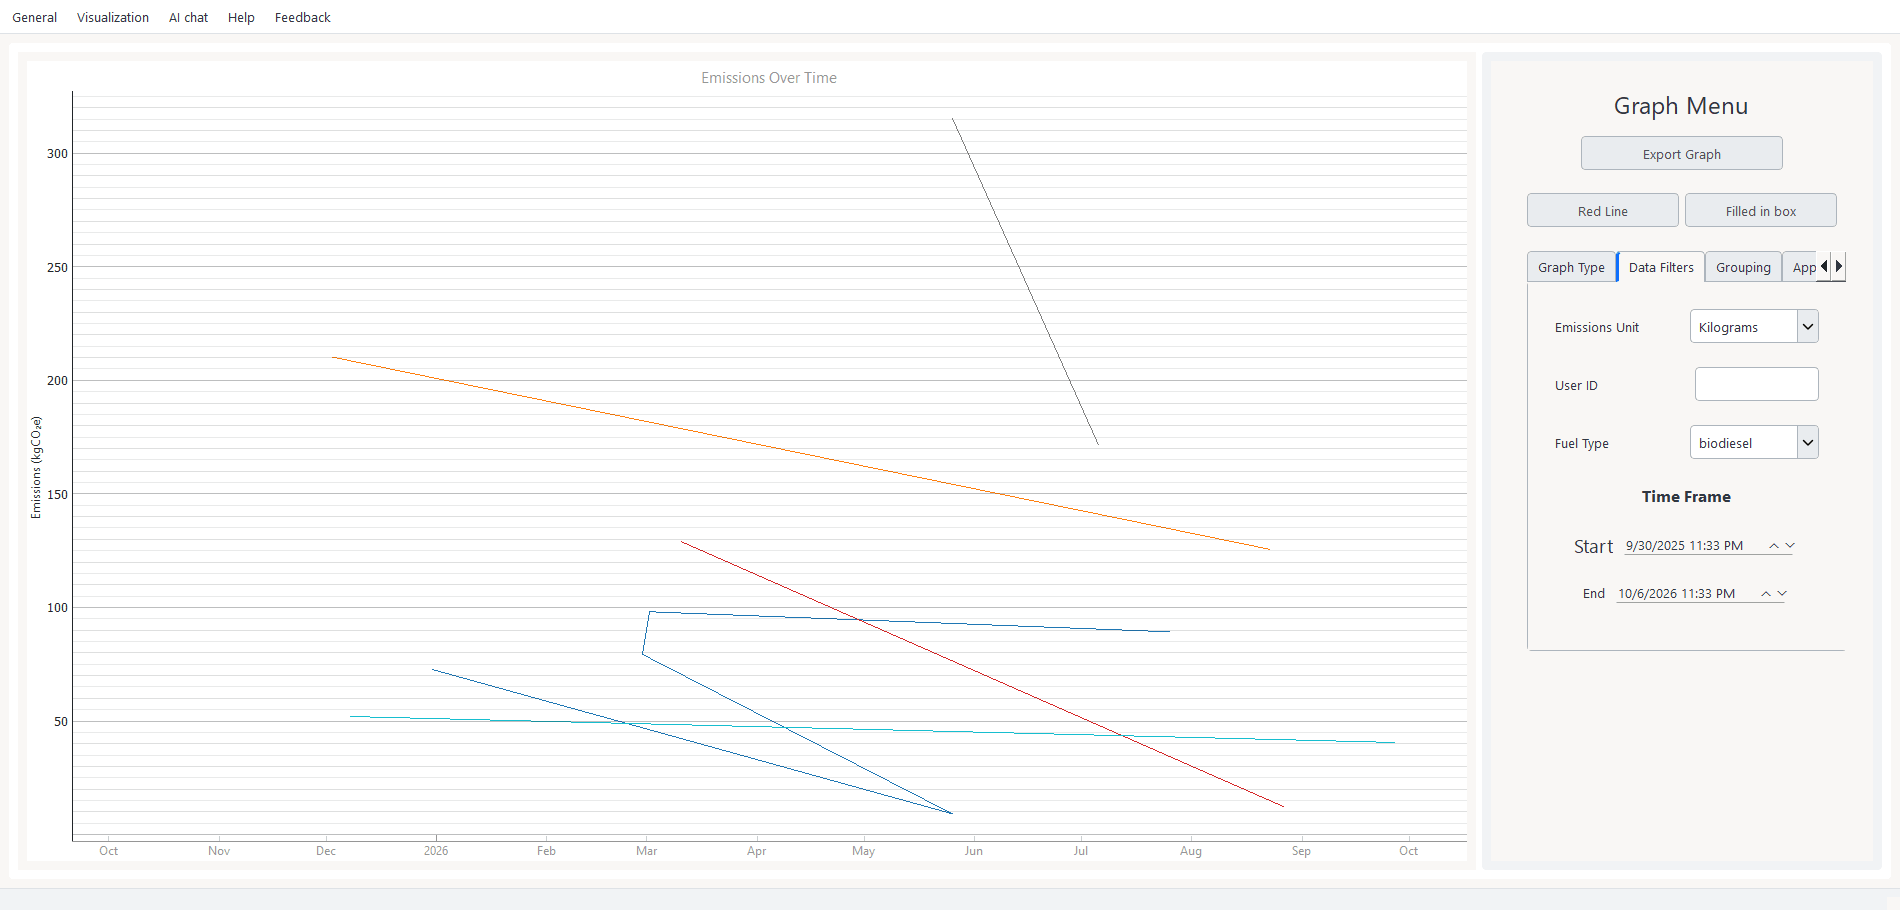
Calculations are saved to a local database, and the Visualization tab charts emissions over time per user, filtered by fuel, unit, and date range.
What I worked on
I worked with Luis throughout the development time on concepts, ui, documentation, presentation, codebase analysis, and flow charts.